Abstract
This paper presents a numerical investigation into modeling steady-state airflow in a room equipped with displacement ventilation. The study utilizes computational fluid dynamics (CFD) analysis conducted with the AirDummies software. The obtained results are subsequently validated against established experimental findings documented in prior literature. The paper begins by stressing the vital integration of displacement ventilation with CFD simulations, a crucial step in aligning theoretical concepts with real world engineering solutions. It then proceeds to thoroughly detail the experimental setup and numerical techniques utilized, culminating in a meticulous comparison between numerical predictions and experimental findings. The Standard k-ε, realizable k-ε, RNG k-ε, and k-ω SST turbulence models were utilized along with proper boundary conditions to find the velocity and temperature field in the room at different supply rates and temperature. In the end, it is shown that with the average and maximum temperature difference less than 0.85℃ and 1.5℃ respectively, there is a good agreement between the temperature and velocity profiles obtained from the software and the experimental readings. Furthermore, the paper outlines future directions for expanding software applications, signaling a forward-thinking approach aimed at advancing architectural design and sustainable building practices within the engineering community.
Keywords: displacement ventilation, CFD, AirDummies, validation
Introduction
Displacement ventilation is a heating, ventilation, and air conditioning (HVAC) strategy that has gained significant attention in recent years due to its potential for improving indoor air quality, thermal comfort, and energy efficiency in various building types, including commercial, industrial, and residential spaces. Unlike traditional mixing ventilation systems, which supply air from ceiling diffusers at high velocities to induce mixing within the occupied zone, displacement ventilation delivers supply air at low velocities near the floor level. As a result, the supply air displaces the warmer, contaminated air upwards, creating a stratified air distribution within the space.
The effectiveness of displacement ventilation in providing better indoor air quality and thermal comfort stems from its ability to maintain lower air velocities and reduce the re-suspension of airborne contaminants compared to conventional mixing ventilation systems. Additionally, displacement ventilation takes advantage of the natural buoyancy forces present in heated indoor environments, leading to improved thermal stratification and reduced energy consumption for air conditioning. Chen and Zhang (2011) emphasized the significance of thermal comfort in displacement ventilation design. Their paper discusses how factors such as supply air temperature, air velocity, and air distribution pattern influence occupant comfort and satisfaction. Researchers have developed various indices and criteria to assess thermal comfort in displacement ventilation environments, considering parameters like Predicted Mean Vote (PMV) and Predicted Percentage of Dissatisfied (PPD). Additionally, the ability to maintain good indoor air quality (IAQ) in displacement ventilation systems is highlighted by Chen and Zhang (2011), along with strategies for controlling indoor pollutants, such as volatile organic compounds (VOCs), particulate matter, and bioaerosols. Effective design and operation of displacement ventilation systems will ensure proper ventilation rates, air filtration, and contaminant removal to safeguard occupant health and well-being.
Modeling displacement ventilation systems is crucial for understanding their performance characteristics and optimizing their design for specific building applications. Computational fluid dynamics (CFD) simulations, analytical models, and empirical correlations are commonly employed techniques for modeling displacement ventilation systems. CFD simulations offer detailed insights into the airflow patterns, temperature distribution, and contaminant transport within the occupied space. These simulations require accurate representations of the geometry, boundary conditions, airflow rates, and thermal loads of the building, making them computationally intensive but highly informative tools for design optimization. In a paper by Li and Zhu (2016), the authors discuss the benefits of using CFD over Finite Element Method (FEM) and Finite Volume Method (FVM) in the context of modeling displacement ventilation and chilled ceiling systems. CFD allows for detailed modeling of complex airflow patterns, temperature distributions, and contaminant transport within indoor spaces. This level of detail can provide more accurate predictions of thermal comfort, indoor air quality, and energy performance compared to simplified methods like FEM and FVM. CFD software offers a wide range of modeling capabilities and features that can be tailored to specific simulation requirements. Users can incorporate various boundary conditions, turbulence models, and heat transfer mechanisms to accurately represent the behavior of displacement ventilation systems in different building scenarios. Furthermore, CFD simulations provide visual representations of airflow patterns and temperature distributions, allowing designers and engineers to gain insights into system performance and identify potential issues or optimization opportunities. This visualization capability enhances the understanding of complex fluid dynamics phenomena associated with displacement ventilation. In a nutshell, according to Li and Zhu (2016), CFD offers distinct advantages for modeling complex fluid flow phenomena in displacement ventilation and chilled ceiling systems. Furthermore, Chen and Zhang (2011) indicated that numerical simulations offer way more detailed insights into airflow patterns, temperature distributions, and contaminant transport while experimental studies can be used to validate modeling results. Diving deeper into CFD simulations, it is also mentioned that coupled simulations play a major role in capturing the interactions between different physical phenomena in displacement ventilation systems. Coupled simulations consider the mutual influence of airflow, heat transfer, and contaminant transport, as well as the feedback loops between these processes. For instance, airflow patterns may affect temperature distributions, which in turn influence buoyancy forces and airflow velocities. By coupling these simulations, researchers can accurately predict system performance under dynamic conditions and assess the impact of design choices on multiple criteria simultaneously.
Several studies have investigated the performance of displacement ventilation systems under different operating conditions, building configurations, and occupancy scenarios. For example, a study by Melikov et al. (2003) evaluated thermal comfort and air quality in an office environment equipped with displacement ventilation, highlighting the importance of supply air temperature and distribution pattern on occupant satisfaction. Another study by Heiselberg et al. (2002) developed a CFD model to analyze the airflow patterns and temperature distribution in a classroom with displacement ventilation, demonstrating the influence of room geometry and occupancy density on system performance.
According to the literature, some key parameters affect displacement ventilation systems. Hu et al. (2019) highlighted the influence of room geometry and layout on the performance of displacement ventilation systems. Factors such as room dimensions, ceiling height, furniture arrangement, and obstructions can significantly affect airflow patterns, thermal stratification, and contaminant dispersion within the occupied space. Hu et al. (2019) discussed experimental studies that investigate the impact of different room configurations on system performance and provide insights into optimal design practices for maximizing thermal comfort and indoor air quality. Another contributing factor mentioned by Hu et al. (2019) is the role of occupant interaction with displacement ventilation systems in commercial buildings. Human activities and user preferences can influence airflow dynamics, thermal stratification, and contaminant dispersion within the occupied space. Hu et al. (2019) also discuss experimental studies that examine the effects of occupant behavior on ventilation effectiveness, energy consumption, and indoor environmental quality. Understanding occupant effects with displacement ventilation systems is essential for designing user-centric solutions that meet the needs and preferences of building occupants.
This paper aims to conduct CFD simulations of a standard office room previously investigated by Li et. al (1993), utilizing the AirDummies software. The objective is to validate the software’s capability to accurately predict airflow against the experimental findings of Li et. al (1993). Given AirDummies’ versatility in addressing various industry requirements, validating its effectiveness in modeling displacement ventilation holds significant importance. Consequently, HVAC engineers and ventilation system designers can confidently utilize the software to optimize indoor air quality.
Experimental Setup
As mentioned earlier, the main goal of this paper is to validate the CFD employed by AirDummies against the experimental data. The experimental setup designed and used by Li et. al (1993) comprises a full-scale model of a standard office environment, situated within a spacious laboratory enclosure, as depicted in Figure 1. The enclosing structure serves to regulate the temperature of three exterior surfaces of the test room. Notably, temperature control is not extended to one wall and the ceiling, both of which are subject to ambient thermal conditions within the laboratory. Nevertheless, it is noteworthy that the temperature variance within the laboratory environment remains minimal, fluctuating by less than 1°C during experimental procedures. Additionally, the interior surfaces of the test room consist of walls either painted black or clad with aluminum sheets.
Air is introduced into the test room through a low-velocity flat terminal positioned at floor level. The dimensions of the supply terminal are 0.5 m × 0.45 m, with 50% of its area perforated, resulting in a total opening area of 0.1125 m2. This supply air undergoes both cooling and heating processes, with its temperature regulated to within ±0.2 °C through rapid on-off control mechanisms. Furthermore, the airflow can be adjusted to within 2% accuracy using an orifice located in the supply duct. Exhaust air is expelled through an overflow outlet situated in one of the side walls (referred to as wall 2), measuring 0.525 m × 0.220 m, with an area of 0.1155 m2. The heat source comprises 24 light bulbs of 25 W each, mounted on an aluminum net. These bulbs are arranged uniformly within a cube measuring 0.4 m × 0.3 m × 0.3 m. The cube is filled with aluminum chips to ensure a homogeneous heat distribution and minimize short-wave radiation to the wall surfaces. Positioned 0.1 m above the floor and 2.7 m away from the supply terminal, the heat source facilitates simplified numerical calculations using Cartesian grids.
Temperature measurements are conducted using 59 type T thermocouples with measurement uncertainty of ±0.1 °C. These thermocouples are distributed as follows: 30 measure air temperatures, predominantly near the floor and ceiling; 22 measure wall surface temperatures (five on each wall, one on the ceiling, and one on the floor); five measure exterior surface temperatures of walls and ceiling; and two measure supply and exhaust air temperatures. To minimize the impact of long-wave radiation, thermocouples for air temperature are shielded with aluminum foil.
Velocity measurements employ a Dantec 56C14 temperature-compensated bridge and a Dantec 55R76 fiber-film probe. Sampling of air velocity occurs at a rate of 100 Hz, with measurements taken at ten points in front of the supply terminal over a five-minute period. Following identification of the point of maximum velocity, monitoring continues for approximately 20 minutes to evaluate the energy spectrum of velocity fluctuations and turbulent integral. Calculations for mean velocity, standard deviation, skewness, and flatness are based on five-minute measurements.
To ensure experimental stability, each test is allowed to stabilize for approximately 12 hours following adjustments to supply temperatures, flow rates, or heat load settings. Steady-state conditions are confirmed by exhaust air temperature stability within ±0.2 °C.
The conditions used for the CFD simulation in this paper are summarized as follows:
- Temperature measurements: 30 thermocouples on the pole (the exact location is not mentioned by the experimental study, but we assumed x=3.3m, y=3.05m).
- Air supply: size 0.45×0.5 m2, 50% perforated
- Outlet: size 0.525×0.220 m2
- Heat source: size 0.3×0.4×0.3 m3, location (z=0.1, x=2.7, we assumed y=2.1), powered with 24 light bulbs of 25 W each so maximum 600 W in total.
- Experimental conditions: B1, B2, B3 shown in Table 1. The naming has been kept in the format similar to what was used by Li et. al for easier comparison
- Wall temperature: Curve fit to experimental data
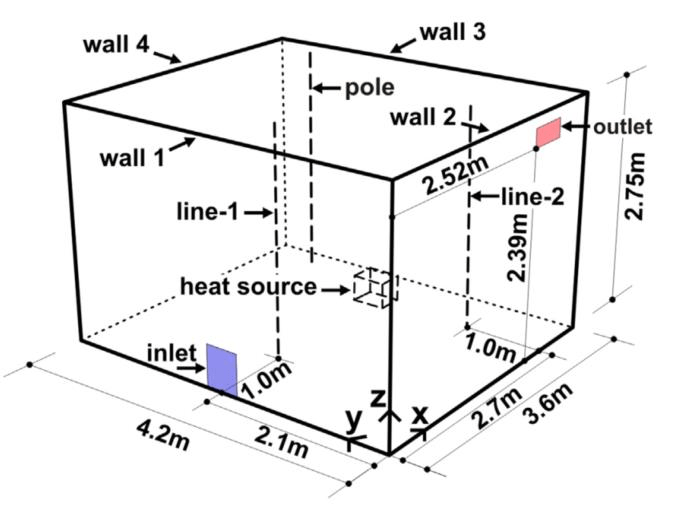
Figure 1: Schematic of the test room with the location of heat source, temperature measurements pole, inlet, and outlet.
Table 1: Condition used for CFD simulations.
| Case | Specific supply flow rate (room volume per hour) | Heat Load (W) | Supply Air Temperature (°C) |
| B1 | 1 | 300 | 16.0 |
| B2 | 2 | 300 | 19.2 |
| B3 | 3 | 300 | 18.0 |
As mentioned earlier, the main goal of this paper is to validate the CFD employed by AirDummies against the experimental data using MAA. Therefore, it is vital to perform the MAA measurements delicately and with extra care. The concentration decay method was employed to evaluate the MAA using SF6 as the tracer gas. At first, the room was set with no ventilation so that the tracer gas reaches a uniform distribution throughout the entire room. Thereafter, the fresh non-marked ventilating air was fed to the room= via the air supply channel located on the west wall (as shown in Figure 1). This was when the tracer gas marking got cut off and the concentration of the gas was decayed as a result of fresh air being fed to the room. Three INNOVA AirTech sensors of monitor type 1302 with sampler/dozer type 1303 were employed to record the concentration of the SF6 with time in order to find the MAA. INNOVA 7620 software was used as the monitoring control unit. MAA was finally calculated by finding the area under the curve of SF6 concentration versus time. The concentration decay curves were measured individually at 23 positions. Some of the points were measured more than once showing a reasonable repeatability where the maximum deviation was found to be 6.5 percent. Most of the measurements were done in the middle longitudinal vertical plane. Several locations in the corners and near the walls were also investigated. Out of all points, we chose three critical points at a distance of 1.13 m, 2.2 m, and 3.2 meters from the west-facing wall.
Results and Conclusion
After drawing the room inside AirDummies, setting the room dimensions, and defining the boundary conditions which include the supply (inlet) air temperature and flow rate, the solution was found as follows. The velocity and temperature contours in the x-z plane is shown in Figure 2 and Figure 3 respectively. As we see, the velocity field is following the physics of the problem where it has the highest values in the middle of the plume one can easily recognize the flow direction by looking at the graph. Furthermore, the velocity vectors are depicted in Figure 4 while streamlines are shown in Figure 5.
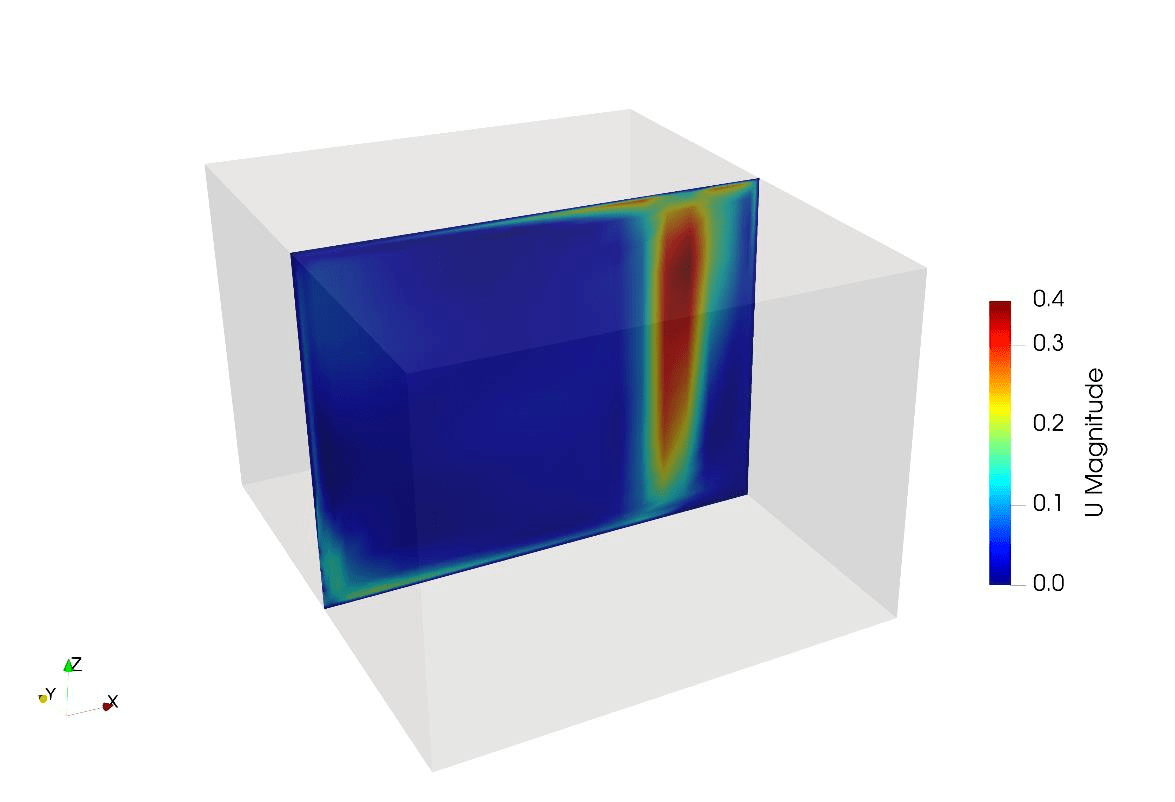
Figure 2: Velocity contour.
.
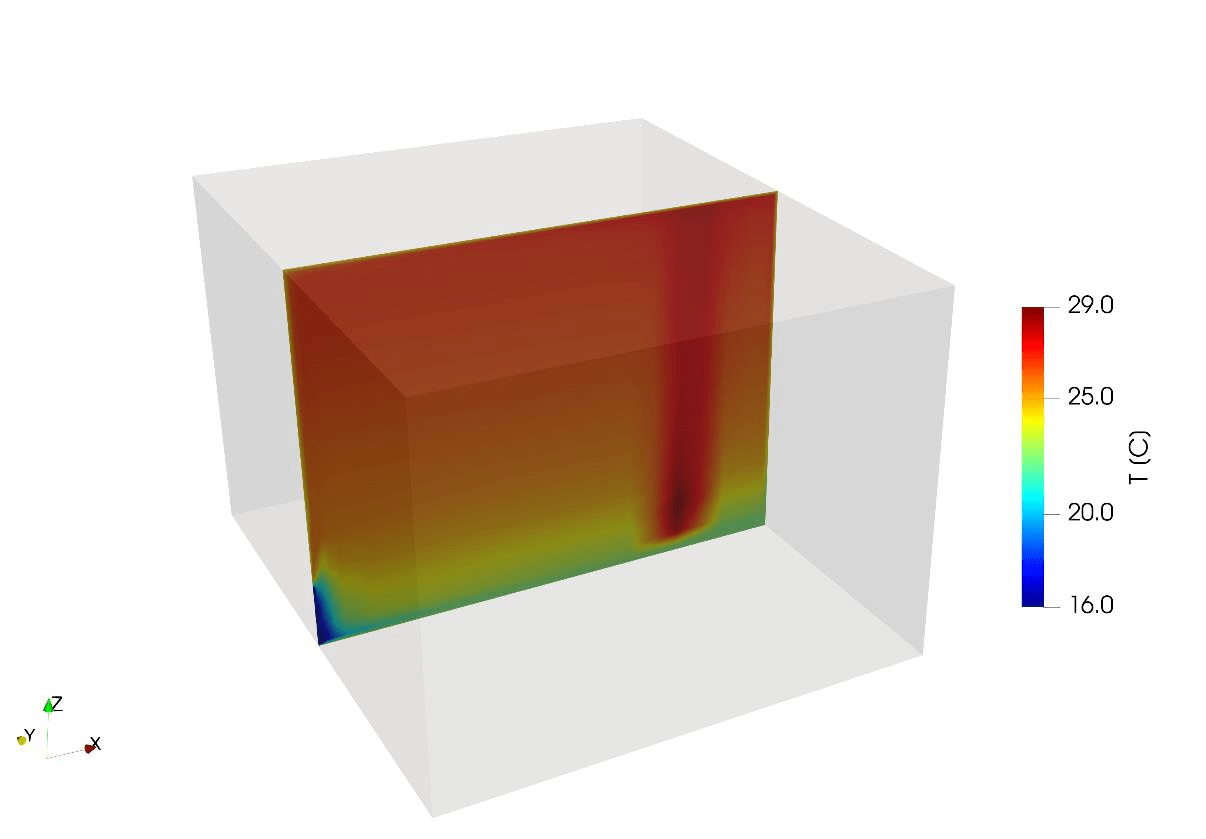
Figure 3: Temperature contour.
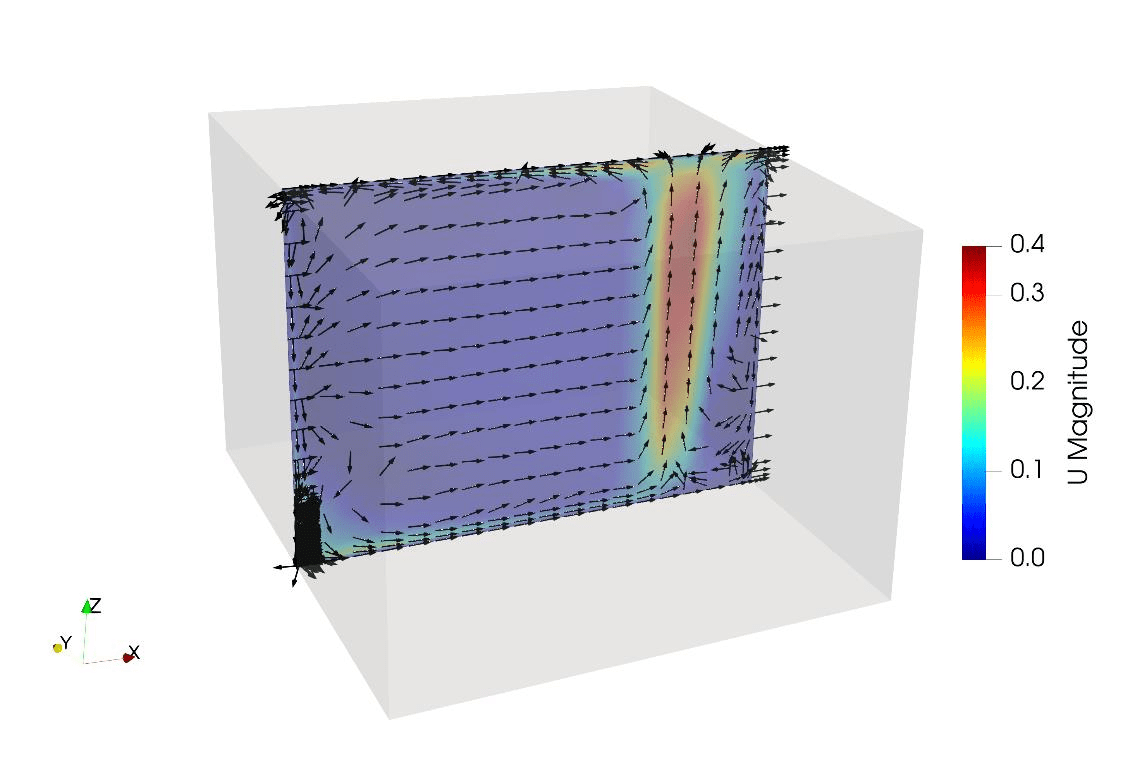
Figure 4: Velocity vectors.
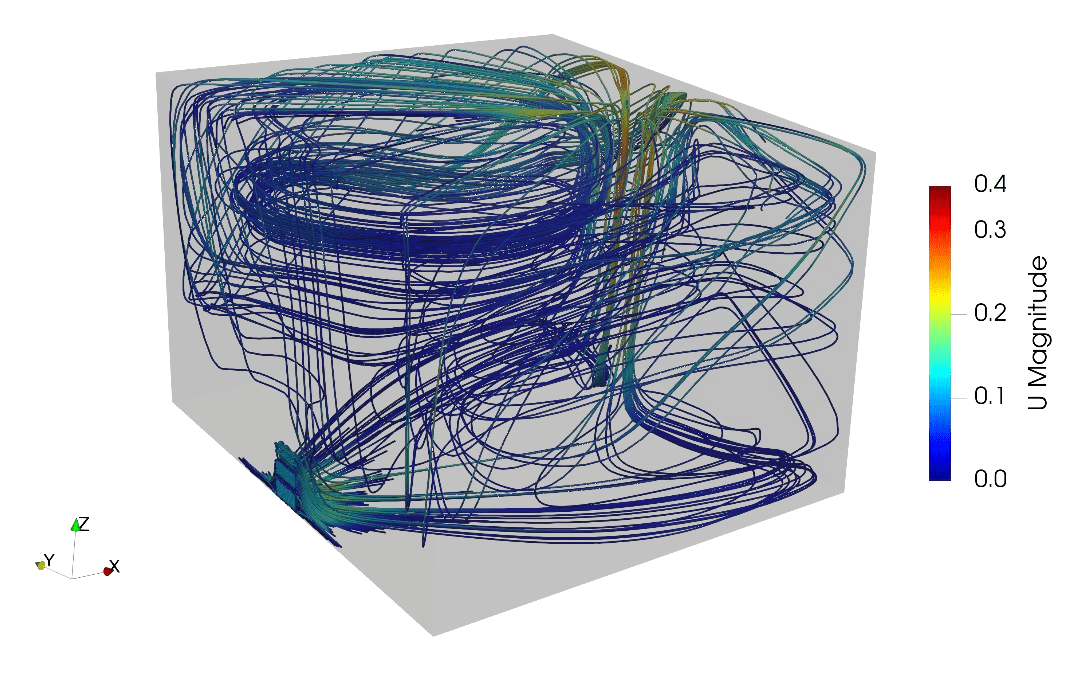
Figure 5: Streamlines.
The Standard k-ε, realizable k-ε, RNG k-ε, and k-ω SST turbulence models were utilized along with proper boundary conditions to find the velocity and temperature field in the room. The temperature profile along the pole shown in Figure 1 is shown in Figure 6 for different turbulence models. According to Figure 6, all turbulence models are following the experimental results especially close to the walls. The
average and maximum temperature difference obtained from the software and the experimental readings is less than 0.85℃ and 1.5℃ respectively (see Table 2). The small deviations would be because of ignoring the radiation heat transfer in the CFD simulation as well as lack of knowledge of the exact location of the pole in the experimental setup. Although k-ω SST yields a more accurate result, standard k-ε model was chosen because of the much faster and easier convergence of the solution. It is worth mentioning that these results belong to case B1 mentioned in Table 1. Finally, temperature profiles of numerical modeling using standard k-ε turbulence model are shown in Figure 6. The results match for all B1, B2, and B3 cases. This indicates that the software provides accurate results regardless of supply air flow rate and temperature.
Table 2: Deviation of simulation results from experimental data for different models presented in Figure 6.
| Turbulence Model | Average Temperature Difference (°C) | Maximum Temperature Difference (°C) |
| k-ω SST | 0.63 | 1.49 |
| Standard k-ε | 0.82 | 1.43 |
| RNG k-ε | 0.77 | 1.42 |
| Realizable k-ε | 0.77 | 1.42 |
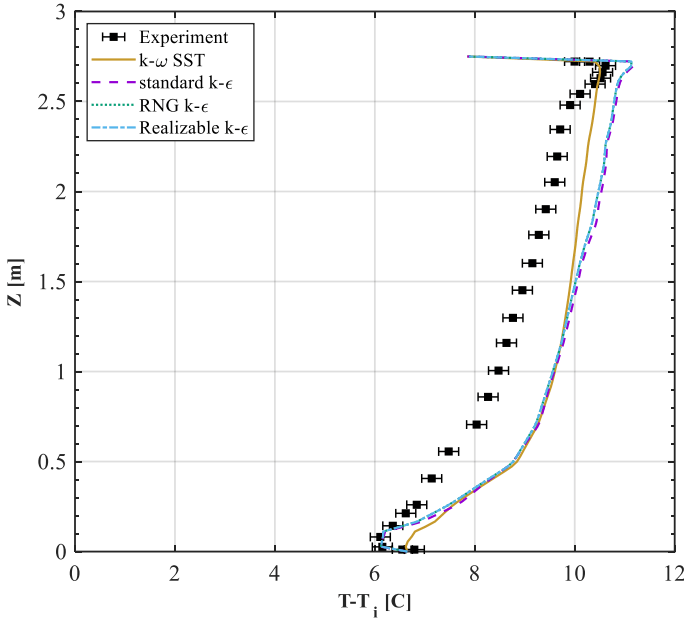
Figure 6: Temperature profiles along the measurement pole for both experimental and numerical modeling.
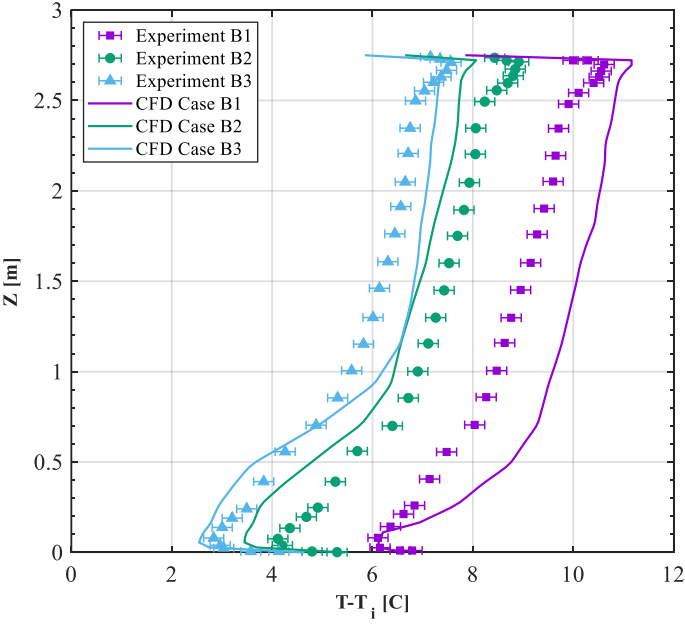
Figure 7: Temperature profiles along the measurement pole for both experimental and numerical modeling for
three different cases shown in Table 1 and using standard k-ε turbulence model.
Future Outlook
Given AirDummies’ remarkable precision and rapid convergence in modeling displacement ventilation, there’s substantial potential for its enhancement to better serve the engineering community, ensuring optimal indoor air quality in buildings. AirDummies facilitates parametric studies to investigate the impact of various design parameters, operational conditions, and system configurations on displacement ventilation system performance. This empowers designers to refine system layouts, air distribution strategies, and integration with passive cooling techniques, thereby enhancing energy efficiency.
Additionally, integrating building energy simulation tools with AirDummies enables acomprehensive evaluation of displacement ventilation’s overall energy performance. By coupling airflow modeling with dynamic thermal simulations, researchers can assess its effects on heating and cooling loads, energy consumption, and indoor environmental quality.
Furthermore, there’s a need to explore uncertainty quantification and sensitivity analysis in displacement ventilation modeling. Addressing uncertainties in model inputs, boundary conditions, and physical parameters is crucial for ensuring simulation accuracy and reliability. Techniques such as Monte Carlo simulations and probabilistic sensitivity analysis help identify sources of uncertainty and their impact on model predictions, while sensitivity analysis methods prioritize influential parameters to optimize model performance.
Moreover, leveraging novel techniques like artificial neural networks and support vector machines using historical data and sensor measurements holds promise for developing predictive models. These datadriven approaches offer opportunities to enhance the accuracy, scalability, and adaptability of displacement ventilation simulations, particularly in dynamic building environments.
References
- Chen, Q., & Zhang, Z. (2011). A review of modeling studies and design strategies of displacement ventilation. Building and Environment, 46(2), 261-277.
- Heiselberg, P., Li, Y., & Nielsen, P. V. (2002). CFD simulation of displacement ventilation in an office room. Energy and Buildings, 34(6), 599-606.
- Hu, S., Yang, B., & Niu, J. (2019). A review of experimental and numerical studies on displacement ventilation in commercial buildings. Energy and Buildings, 184, 154-172.
- Li, A., & Zhu, Y. (2016). A review on numerical modeling of displacement ventilation and chilled ceiling systems. Building Simulation, 9(6), 587-612.
- Li, Yuguo, Mats Sandberg, and Laszlo Fuchs. “Effects of thermal radiation on airflow with displacement ventilation: an experimental investigation.” Energy and buildings 19.4 (1993): 263-274.
- Melikov, A., Kaczmarczyk, J., & Kragh, M. (2003). Displacement ventilation: Measurements in an office environment. Building and Environment, 38(3), 325-336.
- Song, J., Fang, L., & Zhang, Z. (2017). A comprehensive review of modeling and optimization methods for the design of displacement ventilation systems. Energy and Buildings, 151, 1-17.
Here is downloadable file: Validating_Displacement_Ventilation